Integrating Advanced Audit With Aggregated Logging In OpenShift 3.11
Advanced audit is a feature that logs requests at the API server level. When enabled, these logs are output to a log file on the master node but are not caught by the EFK stack in OpenShift. Today, we will walk through the advanced audit feature in OpenShift Container Platform 3.11 and will make modifications to allow it to be integrated with aggregated logging.
Prerequisites
To continue, you must have a running OpenShift 3.11 cluster with logging enabled. The cluster I used for this demo was a single-node, rpm-based installation with the ovs-subnet SDN plugin enabled.
Overview
Before we begin working with advanced audit, let’s dive into the features it has to offer. Advanced audit is an enhancement over the older basic audit. Whereas the basic audit logged all requests to an audit file, advanced audit allows administrators to write a policy file to specify a subset of requests that get logged. This is a good feature for administrators who are only interested in certain interactions. Advanced audit also offers a webhook which can be used to send audit logs to a log aggregator via http or https.
Integration
Now that we know more about advanced audit, let’s integrate this feature with aggregated logging. We will first write a simple policy file to specify which requests will be logged. Then, I will demonstrate two different ways to integrate with aggregated logging – once using hostpath mounts and another using the webhook.
Policy File
In this example, we will write a simple policy file to log when an authenticated user creates or deletes an OpenShift project.
Write the policy file below to /etc/origin/master/audit-policy.yaml.
apiVersion: audit.k8s.io/v1beta1
kind: Policy
rules:
  - level: Metadata
    userGroups: ["system:authenticated:oauth"]
    verbs: ["create", "delete"]
    resources:
      - group: "project.openshift.io"
        resources: ["projectrequests", "projects"]
    omitStages:
      - RequestReceived
By default, the advanced audit will log two events per request – once when an API request is received and another when it is completed. In this example, we will log only when the request is completed and omit logs that signal when the request was received, as noted by the “omitStages” key.
Now that the policy file is created, continue to Hostpath Mounts or Webhook, depending on your preferred strategy of integration. Then, continue to Test it out to see the integration in action.
Hostpath Mounts
Fluentd is deployed as a daemonset that deploys replicas on nodes labeled logging-infra-fluentd. With this label on master nodes, fluentd will be deployed as a container on the same node as the audit logs. This means that fluentd can be made aware of the logs by creating hostPath mounts on the API server and the fluentd deployment.
Create a directory called /etc/origin/master/audit on the master. This directory will contain audit logs produced by advanced audit and will be used to mount a hostPath on the API server and fluentd deployment.
mkdir /etc/origin/master/audit
Modify the fluentd daemonset to mount this directory to its running instances.
oc set volume ds/logging-fluentd --add --mount-path=/etc/origin/master/audit --name=audit --type=hostPath --path=/etc/origin/master/audit -n openshift-logging
Now, let’s modify /etc/origin/master/master-config.yaml to enable the auditing feature.
...
auditConfig:
  auditFilePath: /etc/origin/master/audit/audit-ocp.log
  enabled: true
  maximumFileRetentionDays: 10
  maximumFileSizeMegabytes: 10
  maximumRetainedFiles: 10
  logFormat: json
  policyFile: /etc/origin/master/audit-policy.yaml
...
Restart the master for the changes to take effect.
master-restart api
master-restart controllers
Now it’s time to tell fluentd where to find the audit logs and how to pass them along to ElasticSearch. Edit the logging-fluentd configmap and add the following configuration in the fluentd.conf file.
oc edit cm/logging-fluentd -n openshift-logging

## sources
...
@include configs.d/user/input-audit.conf
##
While still editing the configmap, add the following configuration to a separate file called input-audit.conf.
...
  input-audit.conf: |
    <source>
      @type tail
      @id audit-ocp
      path /etc/origin/master/audit/audit-ocp.log
      pos_file /etc/origin/master/audit/audit.pos
      tag audit.requests
      format json
    </source>
    <match audit**>
      @type copy
      <store>
        @type elasticsearch
        log_level debug
        host "#{ENV['OPS_HOST']}"
        port "#{ENV['OPS_PORT']}"
        scheme https
        ssl_version TLSv1_2
        index_name .audit

        user fluentd
        password changeme

        client_key "#{ENV['OPS_CLIENT_KEY']}"
        client_cert "#{ENV['OPS_CLIENT_CERT']}"
        ca_file "#{ENV['OPS_CA']}"

        type_name com.redhat.ocp.audit

        reload_connections "#{ENV['ES_RELOAD_CONNECTIONS'] || 'false'}"
        reload_after "#{ENV['ES_RELOAD_AFTER'] || '100'}"
        sniffer_class_name "#{ENV['ES_SNIFFER_CLASS_NAME'] || 'Fluent::ElasticsearchSimpleSniffer'}"
        reload_on_failure false
        flush_interval "#{ENV['ES_FLUSH_INTERVAL'] || '5s'}"
        max_retry_wait "#{ENV['ES_RETRY_WAIT'] || '300'}"
        disable_retry_limit true
        buffer_type file
        buffer_path '/var/lib/fluentd/buffer-output-es-auditlog'
        buffer_queue_limit "#{ENV['BUFFER_QUEUE_LIMIT'] || '1024' }"
        buffer_chunk_limit "#{ENV['BUFFER_SIZE_LIMIT'] || '1m' }"
        buffer_queue_full_action "#{ENV['BUFFER_QUEUE_FULL_ACTION'] || 'exception'}"

        request_timeout 2147483648
      </store>
    </match>
...
Force a redeploy of fluentd to reload the configuration.
oc delete po -l component=fluentd -n openshift-logging
The cluster is now properly configured to integrate advanced audit with aggregated logging. Continue to Test it out to see this in action.
Webhook
An alternative solution to hostpath mounts is the webhook native to the advanced audit, in which a kubeconfig-like file can be created to forward the logs to a log aggregator. In this example we will forward the logs to the EFK stack, but the webhook could also be used to send logs to an aggregator external to OpenShift.
First, modify the fluentd configmap to accept http input and to pass the logs to ElasticSearch.
oc edit cm/logging-fluentd -n openshift-logging

## sources
...
@include configs.d/user/input-audit.conf
##
While still editing the configmap, add the following configuration.
...
  input-audit.conf: |
    <source>
      @type http
      @id audit-ocp
      port 9880
    </source>
    <match audit**>
      @type copy
      <store>
        @type elasticsearch
        log_level debug
        host "#{ENV['OPS_HOST']}"
        port "#{ENV['OPS_PORT']}"
        scheme https
        ssl_version TLSv1_2
        index_name .audit

        user fluentd
        password changeme

        client_key "#{ENV['OPS_CLIENT_KEY']}"
        client_cert "#{ENV['OPS_CLIENT_CERT']}"
        ca_file "#{ENV['OPS_CA']}"

        type_name com.redhat.ocp.audit

        reload_connections "#{ENV['ES_RELOAD_CONNECTIONS'] || 'false'}"
        reload_after "#{ENV['ES_RELOAD_AFTER'] || '100'}"
        sniffer_class_name "#{ENV['ES_SNIFFER_CLASS_NAME'] || 'Fluent::ElasticsearchSimpleSniffer'}"
        reload_on_failure false
        flush_interval "#{ENV['ES_FLUSH_INTERVAL'] || '5s'}"
        max_retry_wait "#{ENV['ES_RETRY_WAIT'] || '300'}"
        disable_retry_limit true
        buffer_type file
        buffer_path '/var/lib/fluentd/buffer-output-es-auditlog'
        buffer_queue_limit "#{ENV['BUFFER_QUEUE_LIMIT'] || '1024' }"
        buffer_chunk_limit "#{ENV['BUFFER_SIZE_LIMIT'] || '1m' }"
        buffer_queue_full_action "#{ENV['BUFFER_QUEUE_FULL_ACTION'] || 'exception'}"

        request_timeout 2147483648
      </store>
    </match>
...
Force a redeploy of fluentd to reload the configuration.
oc delete po -l component=fluentd -n openshift-logging
When the new pod is ready, determine the IP address of the new logging-fluentd pod.
oc describe po -n openshift-logging $(oc get po -n openshift-logging | grep fluentd | awk '{print $1}') | grep IP
Next, create the webhook kube config /etc/origin/master/audit-webhook.yaml.
clusters:
  - name: fluentd
    cluster:
      certificate-authority: ""
      server: http://<IP-of-fluentd-pod>:9880/audit.request

users:
  - name: api-server
    user:
      client-certificate: ""
      client-key: ""

current-context: webhook
contexts:
- context:
    cluster: fluentd
    user: api-server
  name: webhook
Modify /etc/origin/master/master-config.yaml to enable the auditing feature.
...
auditConfig:
  auditFilePath: /var/log/audit-ocp.log
  enabled: true
  maximumFileRetentionDays: 10
  maximumFileSizeMegabytes: 10
  maximumRetainedFiles: 10
  logFormat: json
  policyFile: /etc/origin/master/audit-policy.yaml
  webHookKubeConfig: /etc/origin/master/audit-webhook.yaml
  webHookMode: blocking
...
Restart the api server.
master-restart api
master-restart controllers
Test It Out
Let’s see what this looks like once everything is configured properly. Use the oc binary to create a new project.
oc new-project test-project
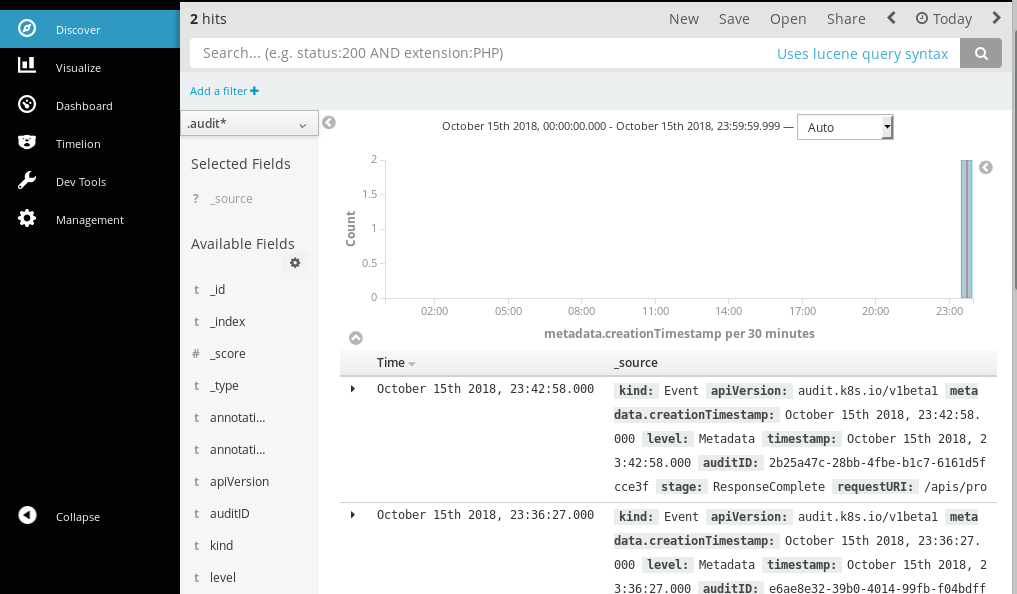
Fluentd will now collect the audit log and pass it along to ElasticSearch. To easily view this in Kibana, create a new index for the audit logs. In Kibana go to Management->Index Patterns->Create Index and enter .audit* as the name of the index. Select metadata.creationTimestamp as the Time-field name and click Create. (This will read as items.metadata.creationTimestamp with the webhook method.)
Navigate to the “Discover” tab and select the new index from the drop-down box. You should see an entry with a variety of different fields, including the user that initiated the request, the type of resource that was created, and the IP address in which the request originated from. An additional request will be logged on the deletion of this project, as specified by the policy file.
oc delete project test-project
After performing these actions, your “discover” page in Kibana should look similar to how it does below:
Summary
Advanced audit allows administrators to see all requests flowing in and out of their OpenShift cluster. Integrating this feature with aggregated logging will allow administrators to be able to visualize this data without needing to stand up additional infrastructure. Whether your strategy is to use hostpath mounts or the webhook, integrating advanced audit with aggregated logging is a simple way to begin auditing your cluster!